> ## Documentation Index
> Fetch the complete documentation index at: https://docs.poix.io/llms.txt
> Use this file to discover all available pages before exploring further.
# Overview
> Page to get all metrics and data about project usage
The Overview page serves as a central hub for monitoring your project's performance, managing resources, and making informed decisions about scaling and optimization.
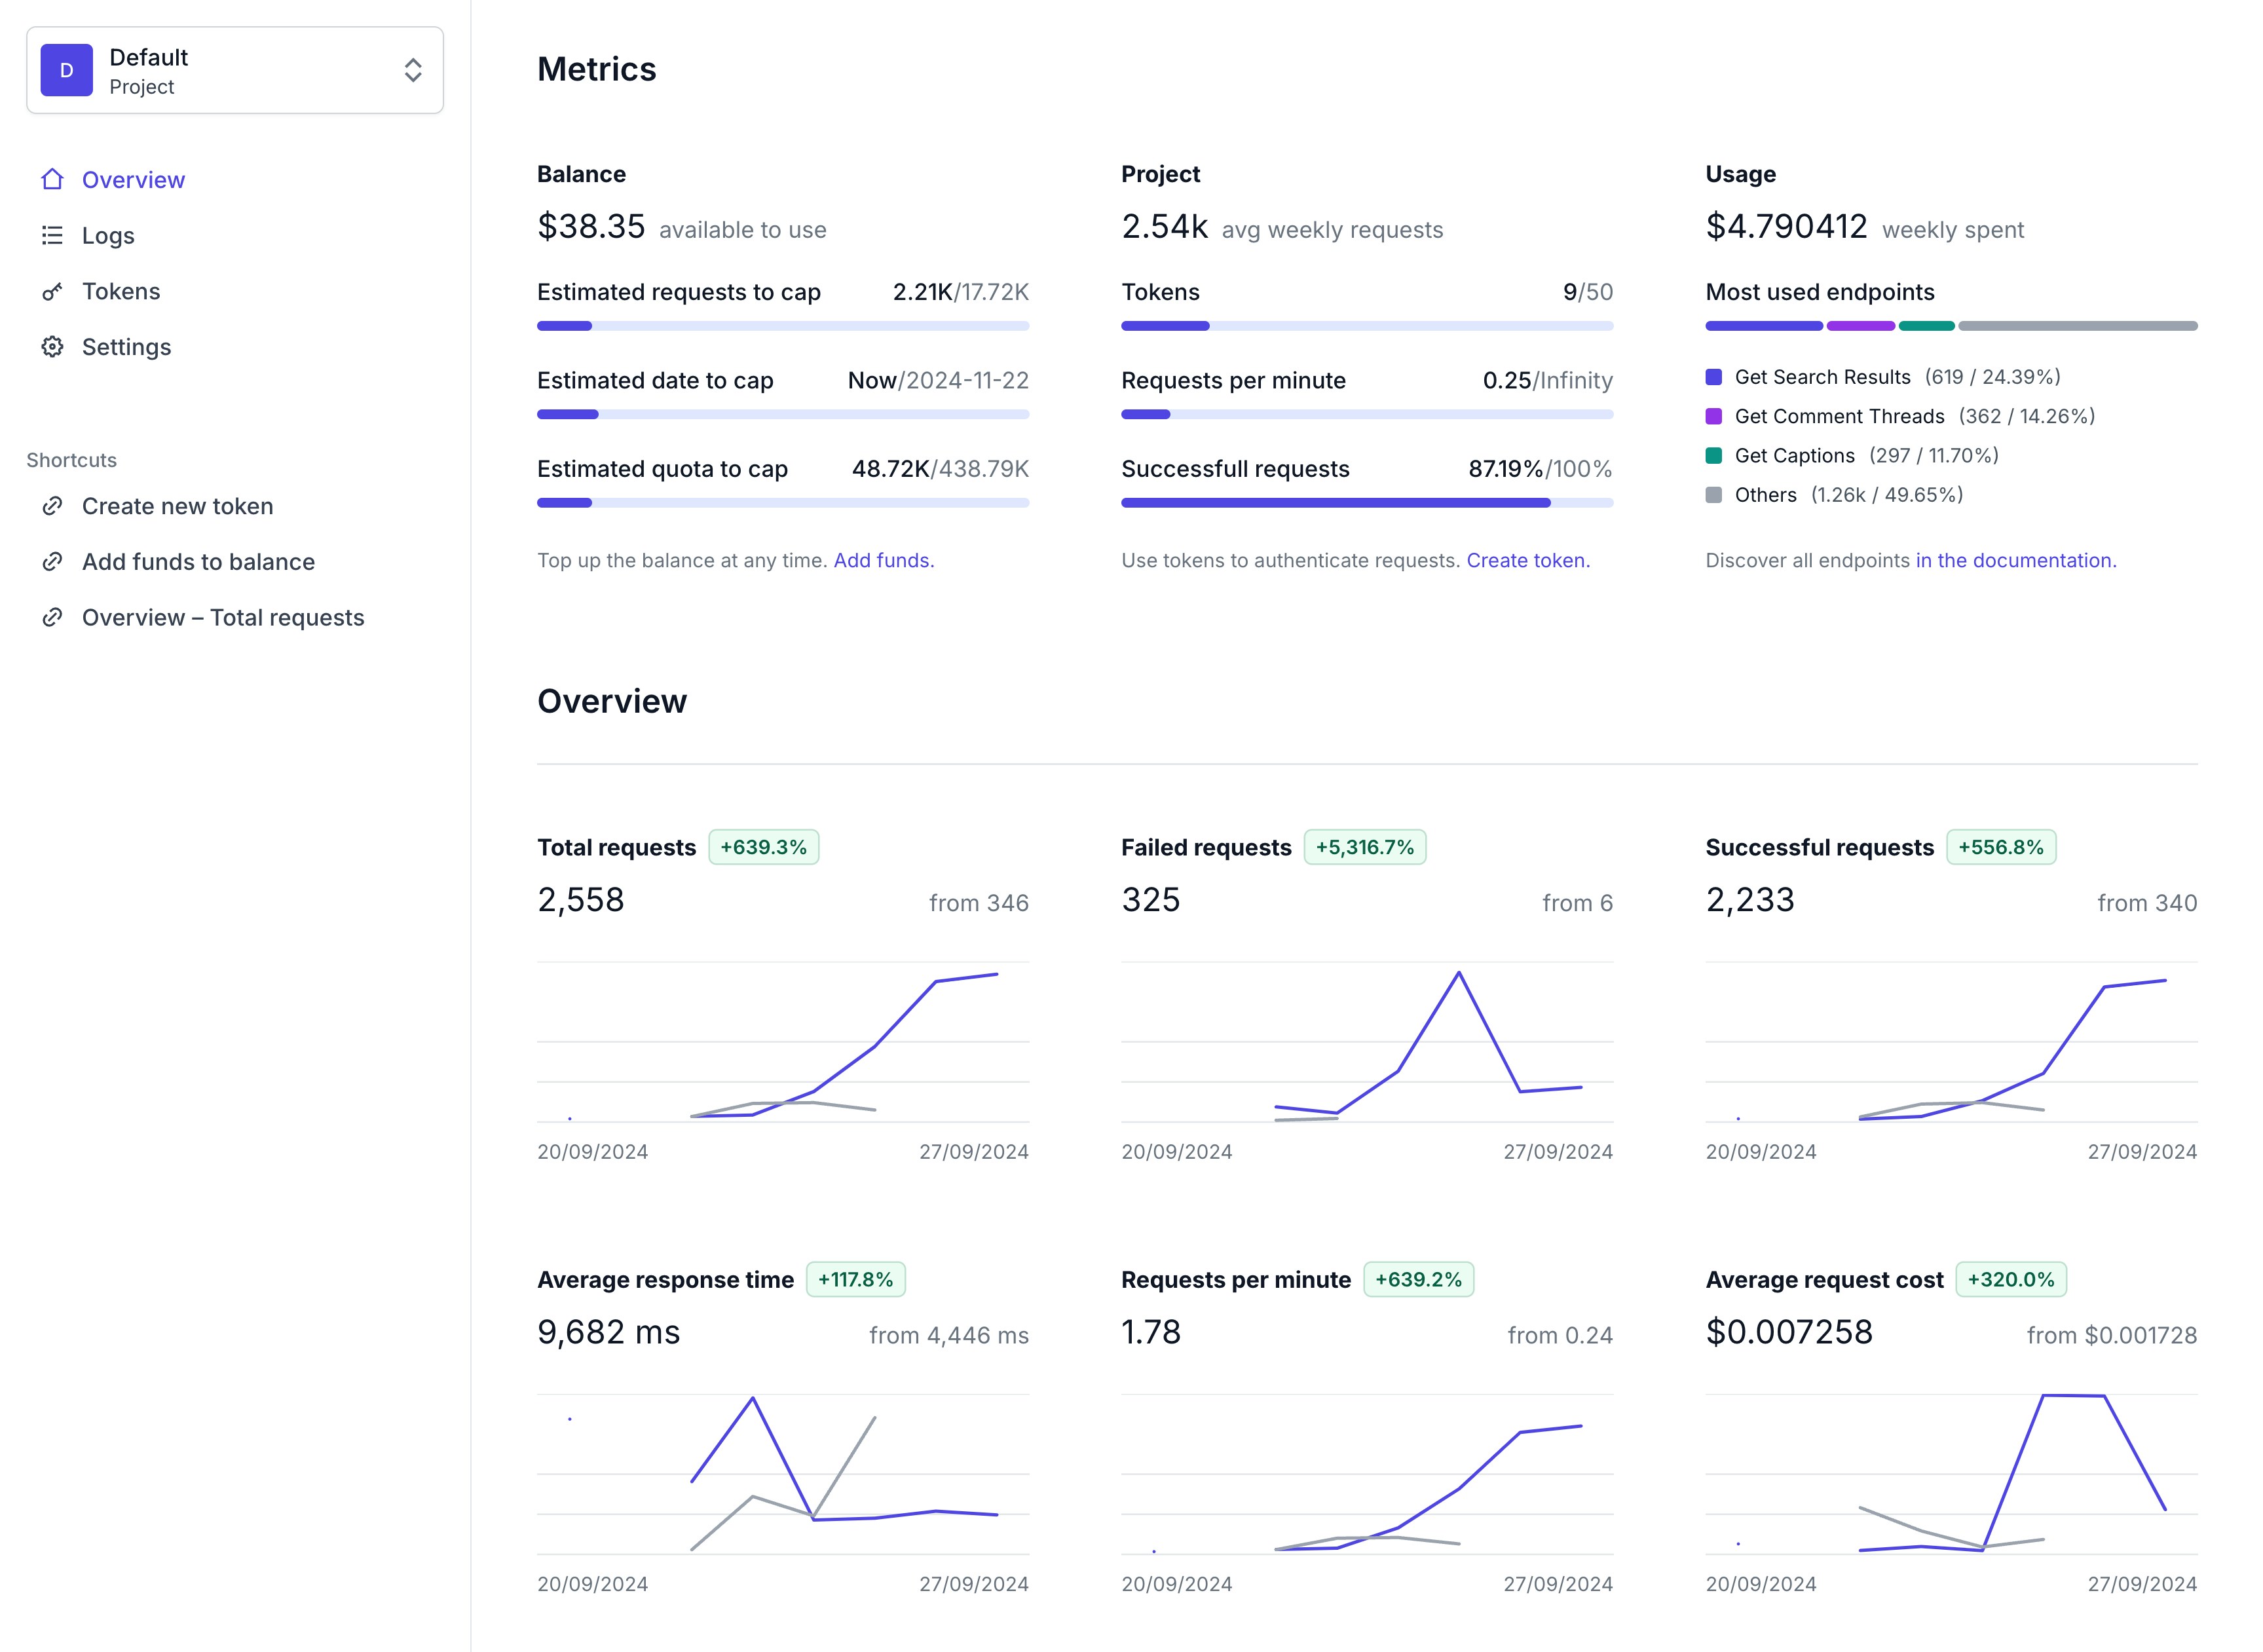
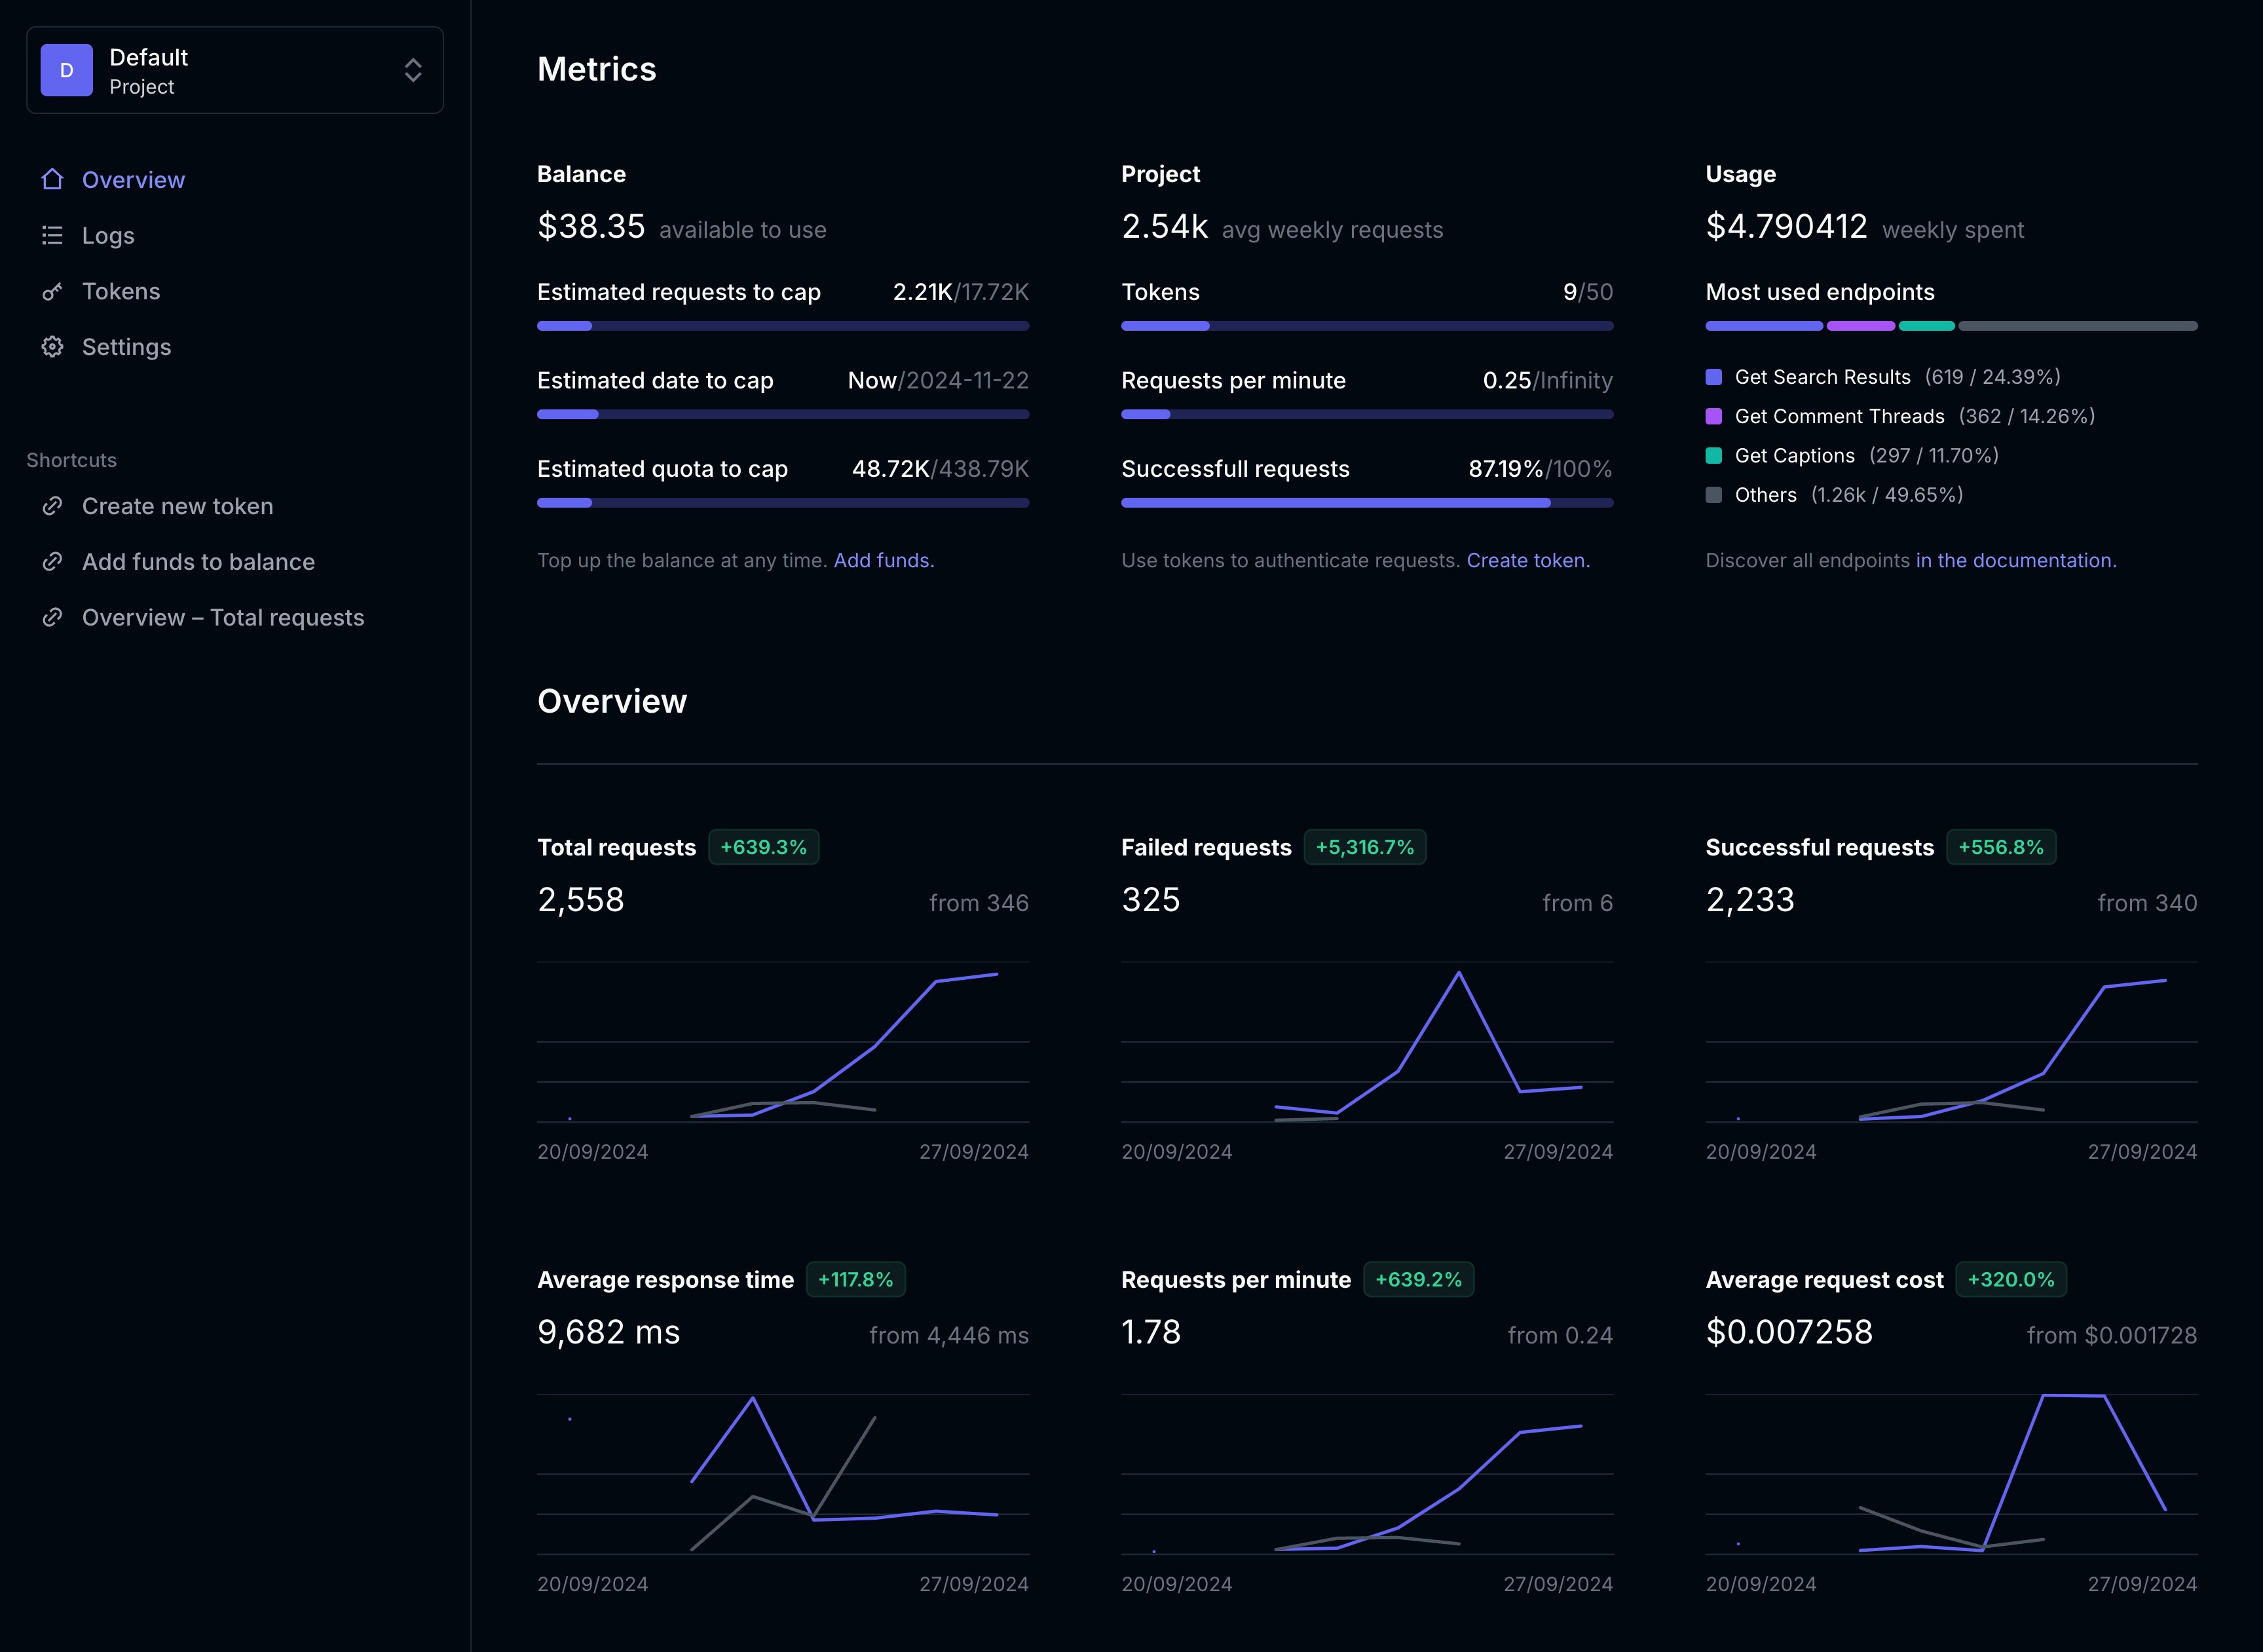 ### Estimated Usage
Get the estimates for future usage:
* **Estimated requests to cap** - Based on average price per request, how many requests can you make with this balance.
* **Estimated date to cap** - Based on the current usage, when will you run out of balance.
* **Estimated quota to cap** - How many requests you can make before running out of quota.
### Usage Breakdown
Breakdown of what endpoints are being used the most:
* Most used endpoints are visualized in a bar chart
* Endpoints are sorted by usage
* Percentage of usage for each endpoint is displayed
### Estimated Usage
Get the estimates for future usage:
* **Estimated requests to cap** - Based on average price per request, how many requests can you make with this balance.
* **Estimated date to cap** - Based on the current usage, when will you run out of balance.
* **Estimated quota to cap** - How many requests you can make before running out of quota.
### Usage Breakdown
Breakdown of what endpoints are being used the most:
* Most used endpoints are visualized in a bar chart
* Endpoints are sorted by usage
* Percentage of usage for each endpoint is displayed